Carbon intensity of electric power sources (Weekly pic)

150521_Climate_Gamble_image.009
IPCC (2014) median estimates of life cycle carbon intensity of selected electricity sources. The figure includes mining, raw material and waste disposal impacts, but excludes infrastructure requirements such as energy storage, strengthened transmission grid, or backup generators. As a result, the figures are likely to underestimate emissions from variable sources such as wind and solar power.

To avert dangerous climate change, we will need lots and lots of low-carbon energy sources. Electricity is perhaps the most important of these, as it is wonderfully flexible form of energy that can replace fossil fuels in multiple applications. Furthermore, it is easy to deliver and we know how to generate it in quantity with very low carbon emissions.

Of all the methods of low-carbon electricity generation, nuclear power is still the single most important. It alone produces far more low-carbon electricity than all the “new” renewables combined. This is an inconvenient fact for those who try to oppose nuclear power while simultaneously opposing climate change. As a result, one hears constantly claims that nuclear power produces greenhouse gases – and that this makes it unsuitable for climate mitigation.

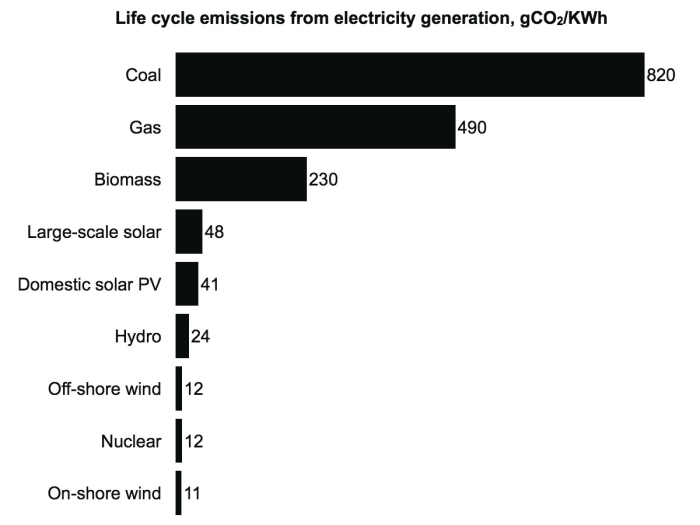
The first part of this claim is true: In fact, no energy source produces energy without greenhouse gas emissions of any kind. There are emissions associated with wind power, and there are emissions associated with solar power. The second part, the inference, is false, however. In all the serious research on the subject, the carbon balance of nuclear electricity is found to be very low. It compares well with wind power and, in fact, tends to be lower than that of solar electricity.

The most common counterargument we’ve heard at this point is the obvious: “Wait, what about uranium mining, or building of nuclear power plants? Surely they contribute a lot of emissions?” 

Fortunately, we can say that this counterargument does not hold water. The figures quoted here, and in any serious scientific report, are so-called lifecycle emissions. This means that the figures already include impacts from mining, building of power plants, and so forth. In our opinion, it is somewhat insulting even to think that such obvious emission sources would not be included in any serious calculations.

But one thing that’s not included in these calculations is the additional infrastructure that is required to deliver equivalent level of service. For nuclear power plants, not much additional infrastructure is required, beyond obvious power lines. But if we want to deliver equivalent service – equivalent amount of reliable electricity generation – from variable sources, we most probably are going to need more infrastructure. This can be reinforced electricity grid to transfer energy from places where the wind blows or the sun shines to places where electricity is needed; it can be backup generators that provide power when it’s dark or calm; or it can be wind turbines and solar panels that are part of “overbuild” required to ensure that at least some catch the wind or the sun at all times.

So far, as the share of variable energy sources in electricity grid has remained small, this additional infrastructure is not really needed. The existing grid and existing power plants can cope with the limited variability, although this often incurs extra costs already. But as we expand our low-carbon energy production, we will need more and more infrastructure to cope with increasing variability. This causes both economic and environmental costs, resulting to higher carbon balance than these simple calculations would suggest.

This is one of the reasons why we believe that opposing proven solutions that can provide significant quantities of low-carbon energy is, at this point, a gamble with the climate. For more information, buy our book, Climate Gamble – or come to Paris during the COP21 climate negotiations and get one for free!


Advertisement

The great gamble of renewables-only advocates, in detail (Weekly pic)

Required new energy generation build rates and sustained annual energy efficiency improvements in different climate mitigation scenarios, and historical record rates. Source: Loftus, P. J., Cohen, A. M., Long, J. C. S., & Jenkins, J. D. (2015). A critical review of global decarbonization scenarios: what do they tell us about feasibility? Wiley Interdisciplinary Reviews: Climate Change, 6(1), 93–112. doi:10.1002/wcc.324

In the previous two posts, we showed with IPCC data how the climate mitigation scenarios proffered by anti-nuclear groups are based on extreme optimism on not just one but two counts: they assume that renewables will grow at least as fast as, and that energy demand increase can be checked at least as well, as the most optimistic IPCC projections allow. Generally speaking, if the plan depends on not just one but two factors developing according to the most optimistic assumptions, one might want to have a different plan – especially if at the stake is the future of our only habitable planet.

But how much are these plans assuming, in fact? This important question is partially answered in a recent study by Loftus et al. (2015), which examined 17 widely publicized global decarbonization scenarios. These included three scenarios (from World Watch, Greenpeace, and Stanford professor Mark Jacobson et al.) that explicitly attempted to stabilize the climate without nuclear energy – relying solely on energy efficiency, renewables, and fossil fuels.

The key results are summarized to the graphic above, and compared to short term, historically achieved records (that is, the best single year ever). For renewable only scenarios, energy efficiency needs to improve every year almost twice as fast as has been achieved in the best year in record. Simultaneously, new (renewable) energy generation must be built 1.4 to 15 times (!) faster than new energy generation from all sources together has been ever added in a single year – and this build rate must be sustained for decades.

Succeeding in either one of these alone would be a monumental undertaking. Succeeding at the both at the same time may be technically possible, but it is most certainly a gamble – a Climate Gamble.

This series of posts introduces graphics from our book Climate Gamble: Is Anti-Nuclear Activism Endangering Our Future? The book is now available on Amazon.com in Kindle and paperback formats; see also our crowdfunding initiative which aims to deliver a copy of the book to COP21 climate delegates in Paris this December.

References

Loftus, P. J., Cohen, A. M., Long, J. C. S., & Jenkins, J. D. (2015). A critical review of global decarbonization scenarios: what do they tell us about feasibility? Wiley Interdisciplinary Reviews: Climate Change, 6(1), 93–112. doi:10.1002/wcc.324

World energy use in 2050 – and renewable energy potential per IPCC (Weekly pic)

Sources: IPCC SRREN (2011), Figure 10.2, and IPCC AR5 WG3 Draft (2014), p. 66.
Sources: IPCC (2011): SRREN, Figure 10.2, and IPCC (2014): AR5 WG3: Mitigation of Climate Change, Chapter 7: “Energy Systems,” p. 561. 

In prior installment of our posts introducing the graphics from our book Climate Gamble: is Anti-Nuclear Activism Endangering Our Future?, we showed how the IPCC special report on renewable energy potential actually shows that most scenarios fall far short from supplying the world with enough low-carbon energy in 2050. This picture expands upon the SRREN results by showing IPCC’s latest estimates of world energy demand up to 2050.

IPCC estimates that even if powerful climate mitigation policies are adopted around the world, the world energy demand will most likely be at least 450 exajoules per year (EJ/a), and may be as much as 800 EJ/a. If climate policies are neglected as they are now, the final energy use may be much higher. Since even the highest single outlier in IPCC’s SRREN report forecasts renewable energy potential to be at most 428 EJ/a, we have a major problem.

In short, the non-nuclear energy scenarios rely on two things: that renewables will at the very least succeed as well as the most optimistic of 164 IPCC SRREN energy scenarios suggests; and that energy saving measures will succeed at the very least as well as the most optimistic of IPCC’s energy demand scenarios suggests. (The next week’s installment will explain in more detail what these scenarios demand in practice.) If either one fails to deliver as planned yet alternatives cannot be deployed, we are in deep trouble. Your mileage may vary, but we feel that such optimism amounts to a reckless gamble, as we do not have a planet or plan B to fall back on.

This series of posts introduces graphics from our book Climate Gamble: Is Anti-Nuclear Activism Endangering Our Future? The book is now available on Amazon.com in Kindle and paperback formats; see also our crowdfunding initiative which aims to deliver a copy of the book to COP21 climate delegates in Paris this December.

World energy use and renewable energy potential according to IPCC (Weekly pic)

Sources: IPCC SRREN (2011), Figure 10.4, and IPCC AR5 WG3 Draft (2014), p. 66.

By 2050, Earth will be home to nine to ten billion people. Most of those people will aspire to a higher standard of living, and in poor countries, this will mean more demand for energy supplies. Meanwhile, the raw material deposits the industrialized economy is dependent upon are diminishing in quality, and extracting useful materials will require far more energy inputs. Furthermore, fossil fuels need to be replaced with cleaner alternatives, and since this in many cases involves inherently inefficient conversion processes (for example, pyrolyzing biomass to liquid fuel), the demand for primary energy supplies in these applications will likely rise.

For these and other reasons, almost every serious estimate of the future of world energy demand concludes that the demand will at the very least stay close to current figures, and most likely it will rise substantially. The intergovernmental panel on climate change, IPCC, estimates that even if climate mitigation is taken seriously – which is currently not the case – the world energy demand is likely to rise. A range of scenarios illustrated above trends towards 600 to 700 exajoules per year, and possibly more. If, on the other hand, climate change is approached with the current leisurely fashion, energy demand in 2050 could be much higher: quite possibly as much as 1500 exajoules per year.

You can therefore understand our horror when we realized that the report many environmental organizations lauded as the “most comprehensive” report on the renewable potential so far falls very short of these goals. The report in question, IPCC’s Special Report on Renewable Energy Sources and Climate Change Mitigation or SRREN for short, assessed 164 energy scenarios derived from 16 distinct models. The report was by no means overly critical of renewables; nevertheless, its conclusions are sobering. The most positive outlier scenario out of 164 could perhaps deliver 428 exajoules per year in 2050; the average of all 164 scenarios is just 186 exajoules.

If something goes wrong in either the most positive outlier scenario or in the lower estimates for world energy use, the outcome is clear: the climate is done for. Even 100 exajoules per year from unabated fossil fuel burning would probably be too much, and cause us to fail in our climate goals.

And if anything unexpected happens either with energy demand or with renewable scenarios, the gap between what is needed and what is delivered can be huge.

Yet all this is almost never even mentioned in public discourse. Powerful non-governmental organizations act as if these estimates didn’t even exist, and continue to imply that we could easily power the entire planet with renewables alone. In effect, they act as if the most optimistic outlier in the most comprehensive report to date is something of a “worst case” scenario for renewables, to be easily exceeded when needed.

We believe this to be a huge gamble with our stable climate. At the very least, it is hard to call it responsible policy.

This series of posts introduces graphics from our book Climate Gamble: Is Anti-Nuclear Activism Endangering Our Future? The book is now available on Amazon.com in Kindle and paperback formats; see also our crowdfunding initiative which aims to deliver a copy of the book to COP21 climate delegates in Paris this December.

What is the future of renewable energy? (Weekly pic)

Source: IPCC SRREN (2011), Figure 10.4
Source: IPCC SRREN (2011), Figure 10.2 (Page 803, edited figure number to the correct one 12th September 2015)

It is highly unlikely the world can be powered by renewable energy sources alone by 2050. This is one of the conclusions of the IPCC’s often cited but rarely read Special Report on Renewable Energy Sources and Climate Change Mitigation, or SRREN.

Published in 2011, it reviewed 164 energy scenarios that focus on the role of renewable energy in the world energy supply. While the report finds that the maximum “technical potential” of renewable energy sources is indeed large, these scenarios – which attempted to take into account at least some economic and other practical limitations as well – found that their realizable potential is probably much less.

The above graph sums up the results. Not one of those 164 scenarios could deliver, in 2050, even the amount of energy used in the world in 2010. Even the most positive outlier, based on Greenpeace’s Energy [R]evolution study (which in turn was largely based on data from renewable industry lobbyists) delivered only 428 exajoules per year. The average of all scenarios was much less, only 186 exajoules per year.

The SRREN report was by no means overly critical of renewables. As several commentators noted after the report’s release, it downplayed or even omitted discussion about several problems with high renewables scenarios. For example, the feasibility of different scenarios was not really assessed: they may be technically possible, but can the world politics put them to practice?

And even if the most optimistic of those 164 scenarios is put into practice and runs into no unforeseen difficulties, the world energy demand needs to drop drastically while world population grows to 9 or 10 billion. 

Let’s suppose we’re building a bridge and order 164 engineering analyses of the proposed structure’s soundness. Every single one of these analyses suggests that the bridge will be unlikely to withstand current traffic, much less the likely increase in the future. We proceed with the plans anyway, and even declare that our plan is the only one worth mentioning. Are these the words of a responsible designer?

Are the words of Greenpeace – and others who advocate for zero nuclear energy – responsible, or are they a gamble with the climate?

Sources of world’s energy in 1990 and 2013 (Weekly pic)

Source: BP World Energy Outlook 2014

The second installment of our series of graphics from our book, Climate Gamble: Is Anti-Nuclear Activism Endangering our Future, covers in more detail the share of different energy sources in the world’s energy mix. In our previous weekly pic, we noted that measly 13 percent of world’s energy currently comes from fossil-free sources, a figure that has barely budged since the nuclear build-up ended in the late 1980s. This graph shows that while oil use has (relatively speaking) fallen somewhat, coal use has actually increased compared to 1990. This despite all the promises and negotiations that have aimed at reducing CO2 emissions, of which coal burning is the largest single culprit.

We can also see that while renewables have shown commendable progress, their shares are still very small of the total. Unless the growth of renewables continues at current, unprecedented levels, shunning nuclear power will be a gamble with the world’s climate.

This series of posts introduces graphics from our book Climate Gamble: Is Anti-Nuclear Activism Endangering Our Future? The book is now available on Amazon.com in Kindle and paperback formats; see also our crowdfunding initiative which aims to deliver a copy of the book to COP21 climate delegates in Paris this December.

Share of fossil-free energy from world total, 1965-2013 (Weekly pic)

Source: BP World Energy Outlook 2014.

Kicking off the series of weekly posts with graphs and pictures from the English edition of Climate Gamble is this graph of the share of fossil-free energy as percentage of world total energy use. As we can see from the graph, fossil free energy constitutes only about 13 percent of the total, despite decades of warnings about the dangers of continuing our fossil fuel addiction.

One can also see when was the last time world energy supply was substantially cleaned up: during the nuclear build-up in the 1980s. This is one reason we believe that anti-nuclear activism is gambling with our climate.

The data for the graph comes from BP World Energy Outlook 2014.

This series of posts introduces graphics from our book Climate Gamble: Is Anti-Nuclear Activism Endangering Our Future? The book is now available on Amazon.com in Kindle and paperback formats; see also our crowdfunding initiative which aims to deliver a copy of the book to COP21 climate delegates in Paris this December.